


Djurgården and Slot Entries
Good analytics borrow, great analytics steal

The best advice I can give to anyone trying to get into hockey analytics1 and looking for inspiration is to look at similar sports that have advanced their respective analytics fields much more than hockey has. Those would be basketball and football.
A while ago I saw this article from Stats Perform talking about actions in and entries into the penalty box:
The edge of the box is a liminal space between hope (outside) and expectation (inside). Once an attacking player gets on the ball inside the penalty area their chance of scoring is significantly increased, and so is the potential sanction for a defender who makes a mistake. Preventing your opponents reaching the box, therefore, is the primary aim of most teams.
Now, while there is no area on the rink that perfectly maps onto football’s penalty box, hockey’s slot (home plate, scoring chance area, whatever you want to call it) shares some similarities.
5v5 Shots taken from the slot have, in the 23/24 HA season, about a 10.4% chance of resulting in a goal while shots in the rest of the offensive zone have about a 1.8% chance of lighting the goal lamp.

Thus, being able to get to the slot, to high danger areas is quite important if one wants to generate high danger shots.
Why Djurgården though?

If we look at the team shot metrics I included in last week’s post, we can clearly see that one team that is likely to struggle in this area (be it offensively, defensively or both) is Djurgården. Their share of shots is elite while their share of expected goals is hovering around average. If we look a bit more closely and split the shot and xG shares into their components, we can see that Djurgården is averaging about 0.3 xG less per 60 minutes than you’d expect based on the amount of shots taken alone and are allowing about 0.28 xG more than you’d expect based on the amount of shots allowed.
Both of these value are easily bottom of the league. Let’s take a look at the individual players who have played at least 100 5v5 minutes for DIF this season.

Looks like that gap is present across pretty much the entire lineup.2 Most players perform worse, sometimes significantly worse, if you include shot quality in the on-ice metrics compared to when you look at just the shots for and against.
So, offensively the average DIF shot is less dangerous and the average shot allowed by DIF is more dangerous than league average. What could lead to that? Does Djurgården avoid the slot like Pontus Netterberg avoids the lineup sheet or is there something else going on?
You mentioned something about slot entries?
Using slot shots isn’t a new concept in hockey analytics. The thing that might translate well from football however is using entries into the high danger area as a (hopefully) leading indicator of generating shots from high danger areas.
So a Slot Entry is any time a player ends up with possession of the puck in the slot area. This can be accomplished in a few ways:
somebody passes the puck into the slot
somebody skates the puck into the slot
somebody recovers a puck in the slot (loose puck, off a turnover, etc.)
Some examples from Djurgården’s latest game vs Karlskoga (at 5v5):

and in video form:
Two things to point out:
Firstly, in the video above, I think you can clearly separate the slot entries into two distinct categories, plays made during offensive zone possessions and plays made off the rush. We would expect the skills necessary to facilitate slot entries to differ slightly between the two scenarios. One being mainly playing against 5 defenders in-zone, the other playing against backtracking defenders attacking the offensive zone with speed.
Secondly, teams (or players) who play more get more of a chance to create in the slot, that’s why we usually adjust our metrics for time on ice. But a simple time on ice adjustment is not the kind of adjustment we should be looking to here. The skill we’re trying to isolate is being able to turn possession in the offensive zone into, for lack of a better term, dangerous possession by moving the puck into a more dangerous area of the ice.
We don’t want to include a team’s skill at forechecking or at bridging the NZ2, so adjusting for opportunity here means adjusting for the number of possessions the team has in the offensive zone (both of the rush and in-zone) rather than adjusting for time played.
Using both of these leads to some interesting results. We want to now split the slot entries into Rush and Offensive Zone Possession and adjust for the number of possessions the team had in the OZ.
Offense

The two areas are surprisingly correlated. So when you’re better (or in Djurgården’s case, worse) at generating slot entries off the rush, you are usually also better at generating slot entries vs a set defence.
Let’s take a look at individual players to see what’s going on. What kinds of numbers do the top players in the league put up?
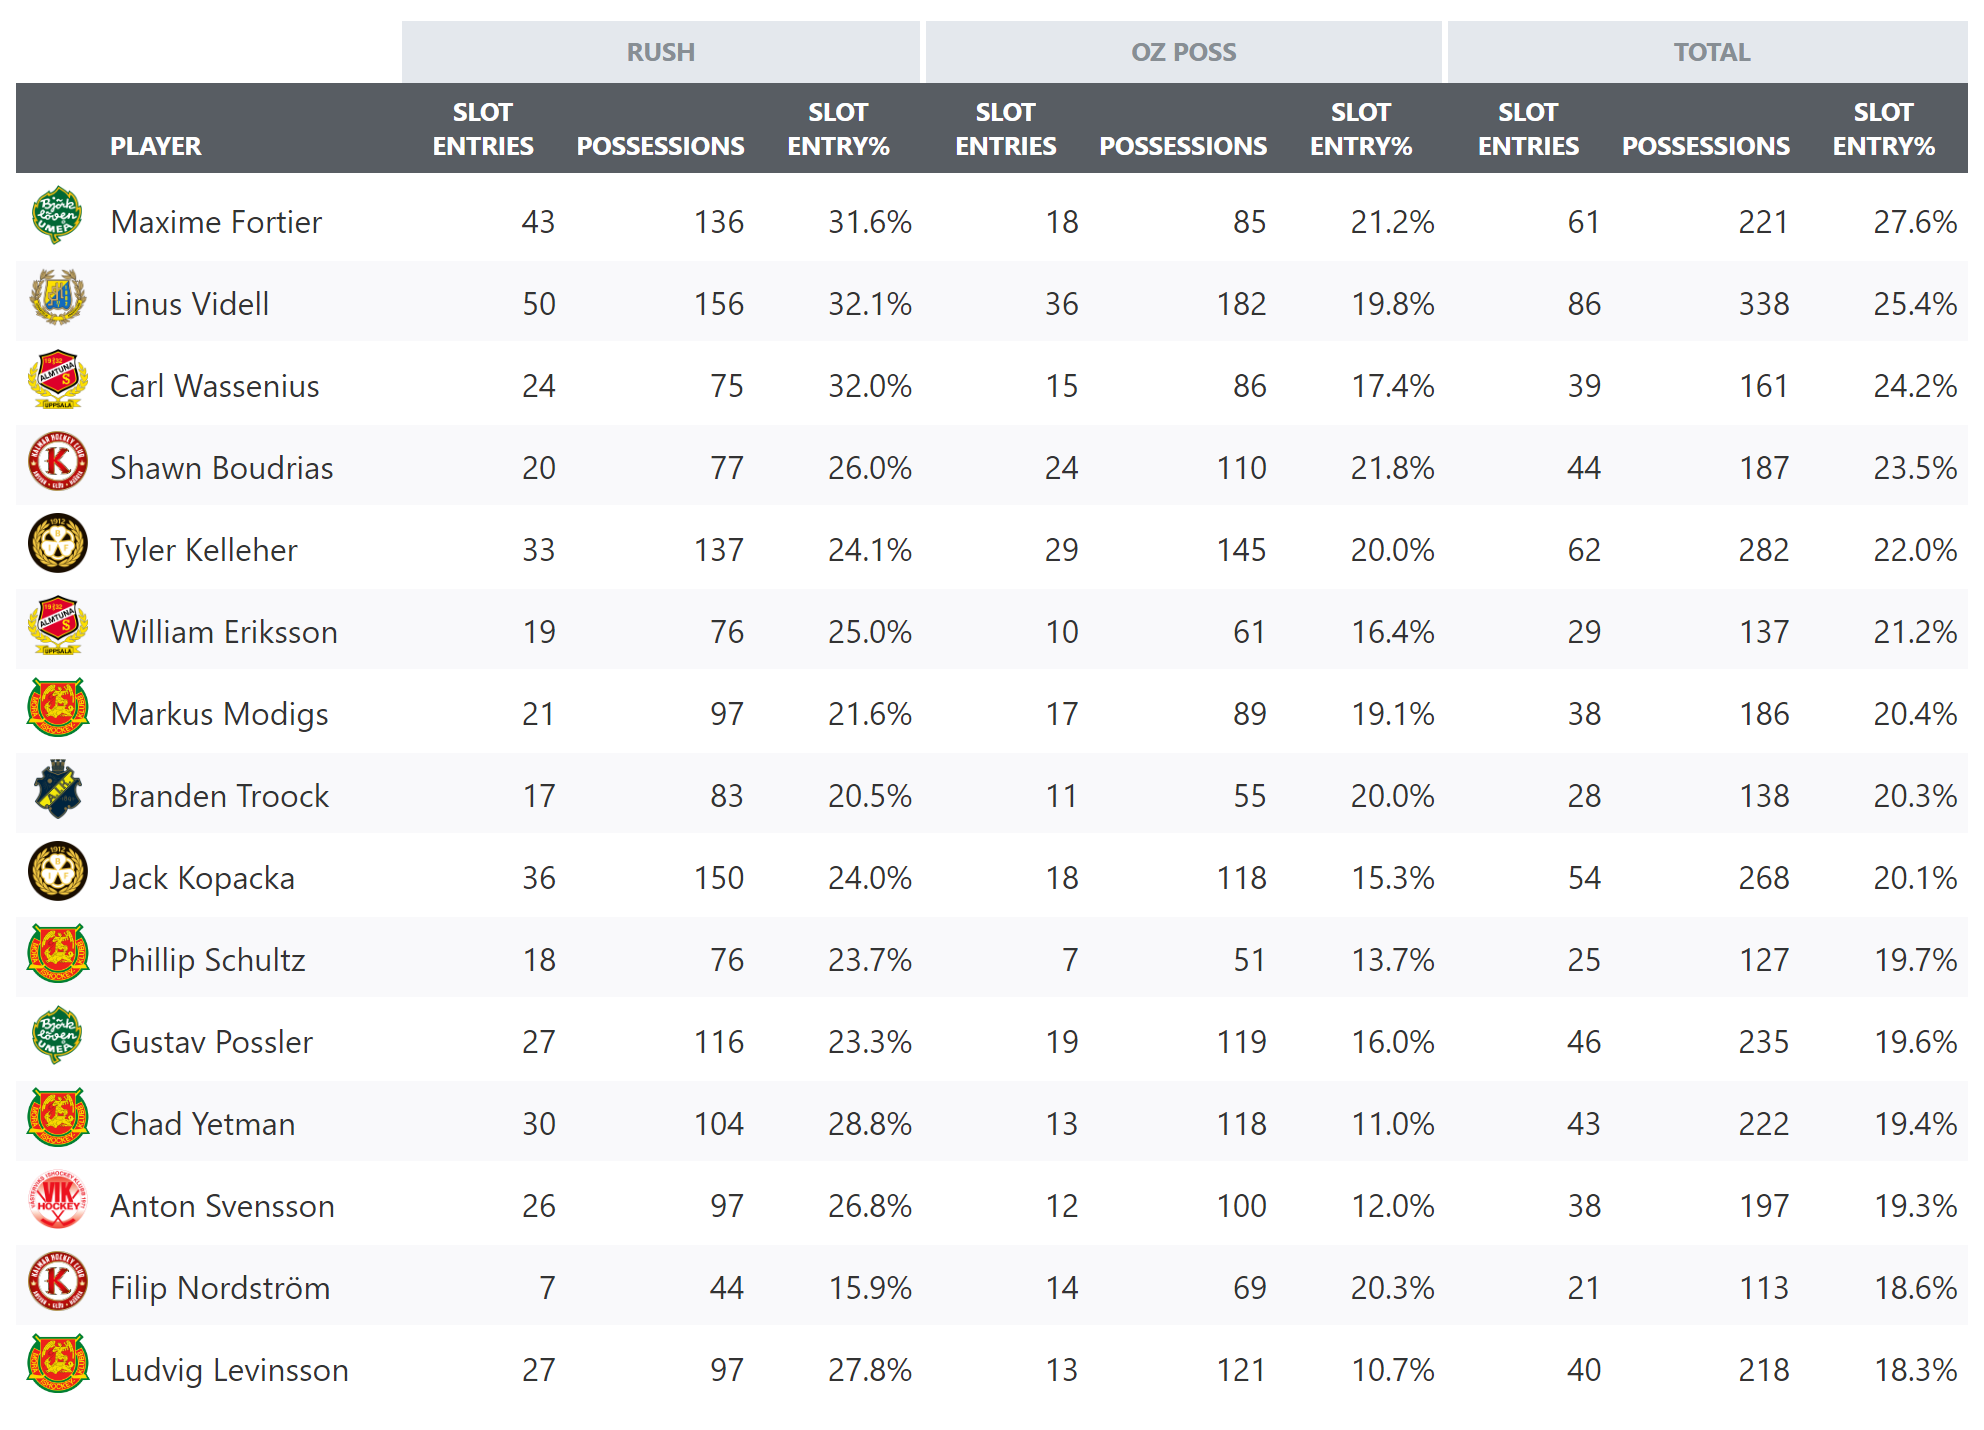
So this gives us a rough estimate. The very top players manage to get into the slot on about 1/3 of their rush possessions and 1/5 of the OZ possessions. Compared to that, where do Djurgården’s forwards stack up? I added the percentile rank for each slot entry% among forwards who have played at least 100 5v5 mins this season.
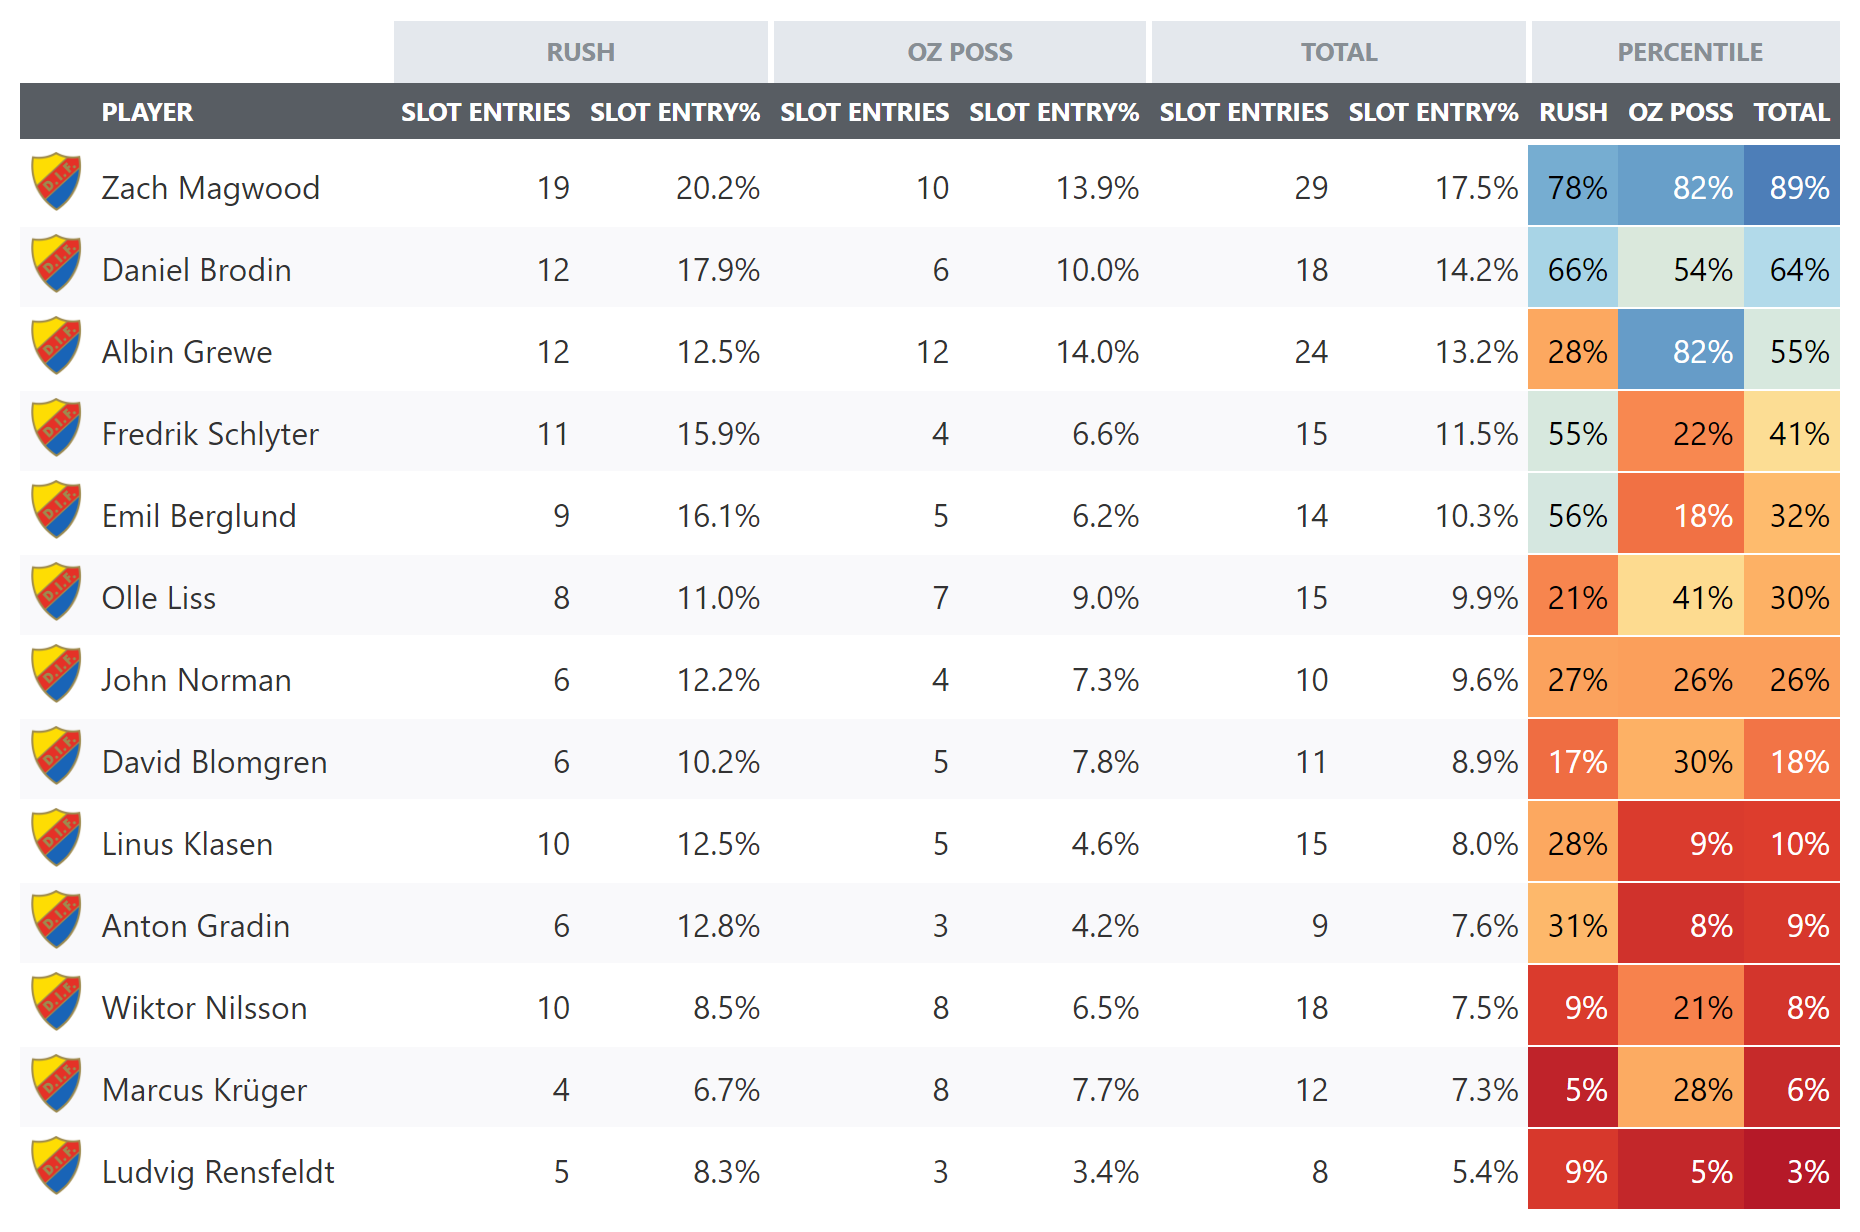

The only forwards above the league average are Magwood, Grewe and Brodin. And it’s not like the rest are no-name scrubs, this is a forward group that isn’t lacking high end names.
Defense

Before we talk about Djurgården, can we take a second to appreciate the defensive performance by Södertälje here? They’re all alone in the bottom left corner both defending the rush and in-zone extremely well. This stands out a lot because it seems like there isn’t much to separate most teams when they’re defending the slot 5v5 in-zone.3
But back to this week’s focus. Clearly Djurgården (overall) don’t stand out positively or negatively defending 5on5 in-zone. They are however worse than average at defending their slot against the rush.
Let’s take a look at individual defenders across the whole league (again, this is mostly to point out that most SSK defenders stick around in the bottom left):

These are on-ice metrics. So, for example, Kevin Karlsson was on the ice for 240 OZ Possessions against by the opponent and in those, Djurgården allowed 40 Slot Entries, resulting in an 16.7% slot entry rate for the opponent. He was also on the ice for 197 rush possessions against and DIF allowed 71 Slot Entries against on those, resulting in a 36% slot entry rate for the opponents.
But since this is a bit hard to read, let’s just zoom in on DIF and include the forwards just for fun.

Marcus Krüger being the most competent defensive forward by quite a bit seems reasonable, he also significantly outperforms the rest of the team by xG share.
Pontus Johansson and Axel Andersson stand out a lot, though. Djurgården is a whole 10 percentage points better at defending the slot against the rush with either of them on the ice. This goes a long way in explaining how they are the only players on the team to have significantly better xG than Corsi numbers. They are very good at shutting the opponent’s attacks down before they get to the dangerous areas of the ice. Something most of the team is lacking, especially on the rush.
But numbers are sorta dry, so let’s have some fun and go to the tape (Safety tip: Djurgården fans may not want to look directly at it4):
tl;dr
Slot Entries can be useful to identify problems if a team is not producing enough/allowing too many high quality chances
DIF specifically is lacking on the offensive side, with most of their forwards unable to convert their possessions in the offensive zone into anything other than shots from the outside. This holds true for both rush possessions and possessions against a set defense in the OZ. Exceptions are Magwood, Brodin and Grewe.
On the defensive side DIF actually do a reasonable job (league average) defending their slot when 5on5 in their own zone. Their main weakness is against rush attacks, with only Almtuna, Västervik and Östersund performing worse. Which is not a set of teams you want to be mentioned with. Exceptions are Pontus Johansson, Axel Andersson and Marcus Krüger.
It might be worthwhile looking into their performance against stretch passes specifically. Though maybe looking at tape of some particularly egregious examples has me biased here.
Djurgården better hope that Frölunda lets Pontus Johansson play out more of his loan and don’t call him back any more because Axel Andersson and him stand out a lot on the blue line and probably deserve even more ice time than they’ve been getting so far.
In fact, in the 56 minutes where Andersson and Johansson were on the ice together, DIF got 2.05 xG for and only 0.52 xG against which amounts to about 79.5 xGF%.
Actually, I’m probably not a good person to hand out advice on this so if you’re genuinely looking for more general advice maybe you should instead listen to some other people.
Don’t worry, I’ll get to the outliers, I’m building towards a big reveal here.
If most teams are grouped together very tightly that would suggest that the differences in allowing chances from set possessions comes down to the number of opportunities allowed for most teams. What I mean by that is if most teams allow opponents to convert a similar percentage of OZ possessions into slot entries, then the way to improve for most teams is to reduce the overall number of OZ possessions they allow their opponents. By… reducing DZ turnovers, being quicker to recover pucks, interrupting cycles. I’m not sure I’m comfortable concluding this from not even half a HockeyAllsvenskan season, but it seems worthwhile to consider.
kinda like fireworks inside a building?