
Quantifying Defensive Stops
Which defenders actually end the opponent's offensive possession?

In Basketball, with it’s ~1:1 possession ratio1, the concept of a “defensive stop” is reasonably basic and something you’ll hear announcers talk about a lot.
The other team brings the ball up the court and if they don’t score, that’s a defensive stop. Obviously using this exact same definition in hockey wouldn’t result in very useful metrics, since pretty much all possessions in hockey end with the team on offense not scoring2. More relavant questions in hockey might be:
Did you prevent the opponent from getting…
a scoring chance
a shot
into a dangerous area (home plate area, for example)
on this possession?
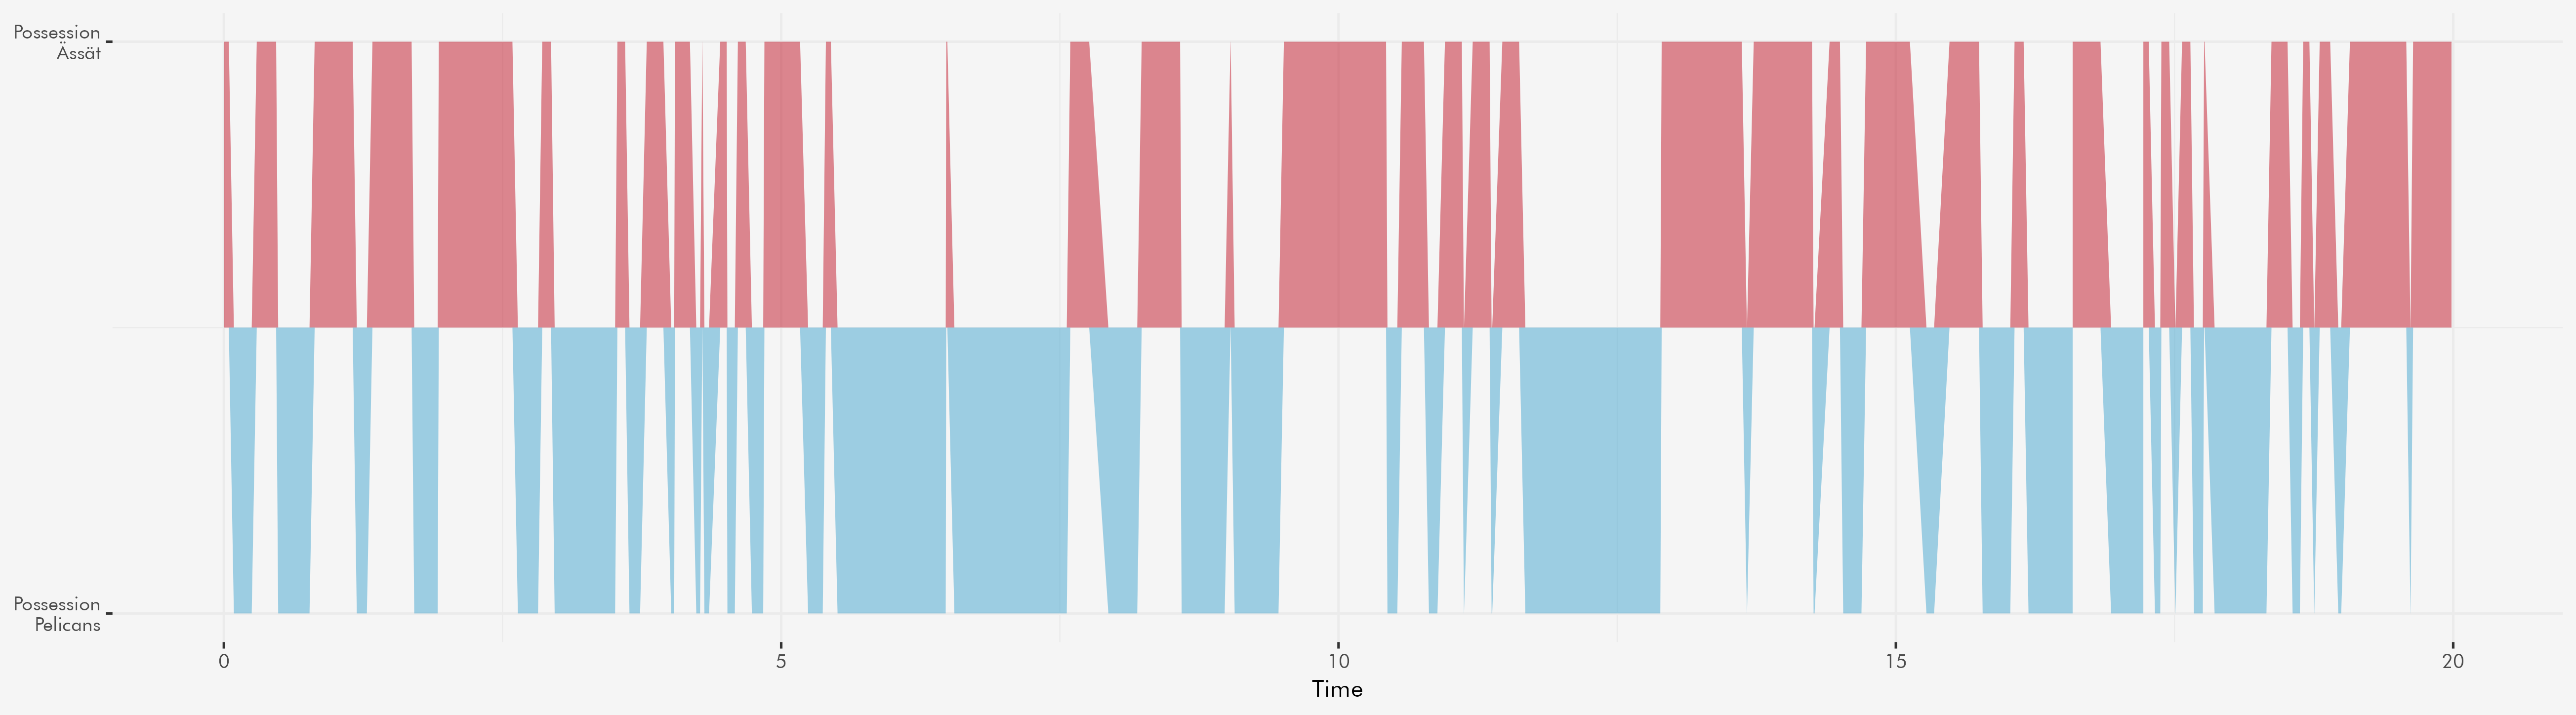
So how would we go about quantifying that? Well, if we split the game into distinct possession sequences, this becomes rather easy. For example, the first period from the Ässät - Pelicans match a few days ago:
Possession Stats
A possession sequence (I’ll just refer to them as “possessions” from here on) is a sequence of play where one team has possession of the puck without any interruption in the form of puck possession by the other team or stoppages in play. I.e. if you break out, dump the puck in, the opponent recovers, tries to dump the puck out but you recover the puck again, that is, by my logic, not one possession but three (your breakout, the opponent’s attempted clearing, your OZ recovery).
Some overall numbers for Liiga in 24/25 to give you a “feel” for possessions:
The average Liiga game has ~ 400 possessions
Roughly 1 in 70 possessions end with a goal
Roughly 1 in 4 possessions end with a shot
Roughly 1 in 2 possessions contain possession in the OZ
The usual reasons for not using overall numbers in hockey analysis3 apply here as well, so let’s focus on 5v5 play:
The average Liiga game has ~ 320 possessions
Roughly 1 in 90 possessions end with a goal
Roughly 1 in 4 possessions end with a shot
Roughly 1 in 2 possessions contain possession in the OZ
Now, not all possessions are created equal, obviously. If you start your possession by recovering the puck in the opponent’s zone, you start out with OZ possession, for example.
46% of possessions are breakouts, i.e. start in the DZ. On these, you end up with possession in the OZ about 28% of the time and with a shot about 14% of the time. 0.7% of breakouts result in a goal. I further split these into quick and set breakouts but that’s for another post.
22% of possessions are OZ Recoveries. By definition, 100% of these give you puck possession in the OZ and ~ 42% of them also contain at least one shot, while 2.1% of them result in a goal. That’s why you teach your kids to forecheck.
18% of possessions are regroups, starting in the NZ. About 41% of Liiga regroups end with OZ possession, 20% with shots. 1% of regroups result in a goal.
The rest is made up of possessions starting with a faceoff win (4.7% OZ Win, 4.6% DZ Win, 3.8% NZ Wins). OZ FOW of course provide lots of shooting opportunities, but of slightly lower quality, NZ and DZ FOW possession give you lower success rates than their open play counter parts:
DZ FOW: 25% OZ Possession, 12% Shot, 0.2% Goal
NZ FOW: 32% OZ Possession, 15% Shot, 0.5% Goal
OZ FOW: 100% OZ Possession, 56% Shot, 2.2% Goal
Defensive Stops
So, what does all this have to do with measuring defensive stops? Let’s pick one of the easier definitions for a defensive stop from above and use shots as the cutoff for defensive success (imperfect, but let’s go with it).
So, for any possession where the opponent has control of the puck in the OZ, if my team doesn’t concede a shot before the possession ends, we’ll count that as a “stop” for the on-ice defenders.
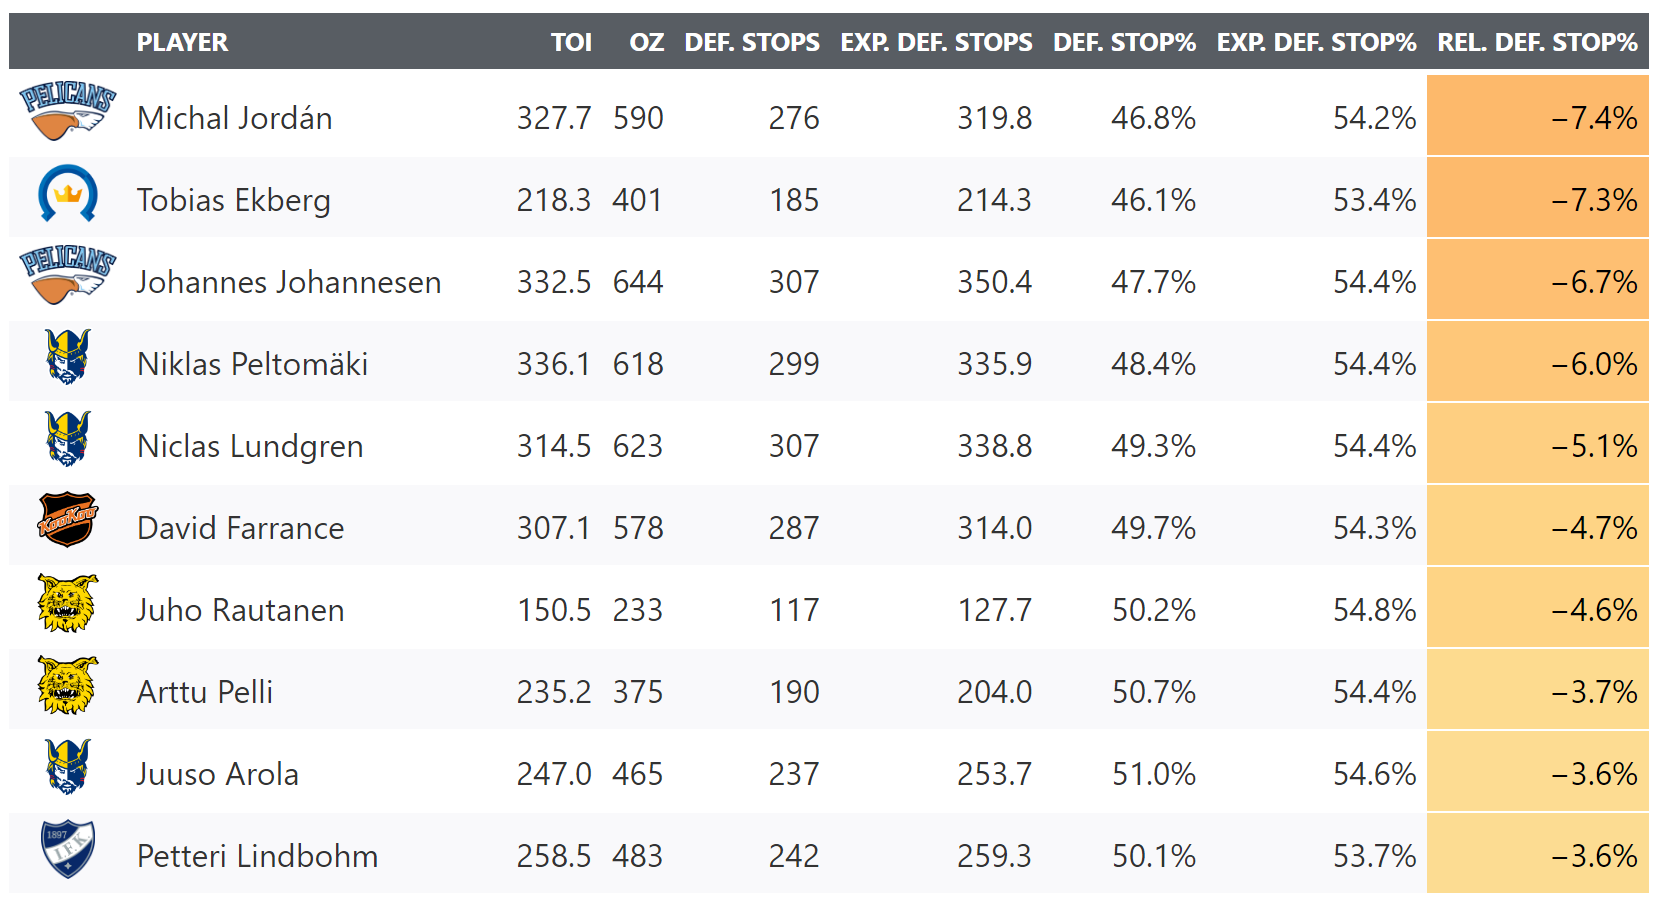
We can simply calculate this for every possession every player in Liiga this season was on the ice for and pull the top 10 defenders:
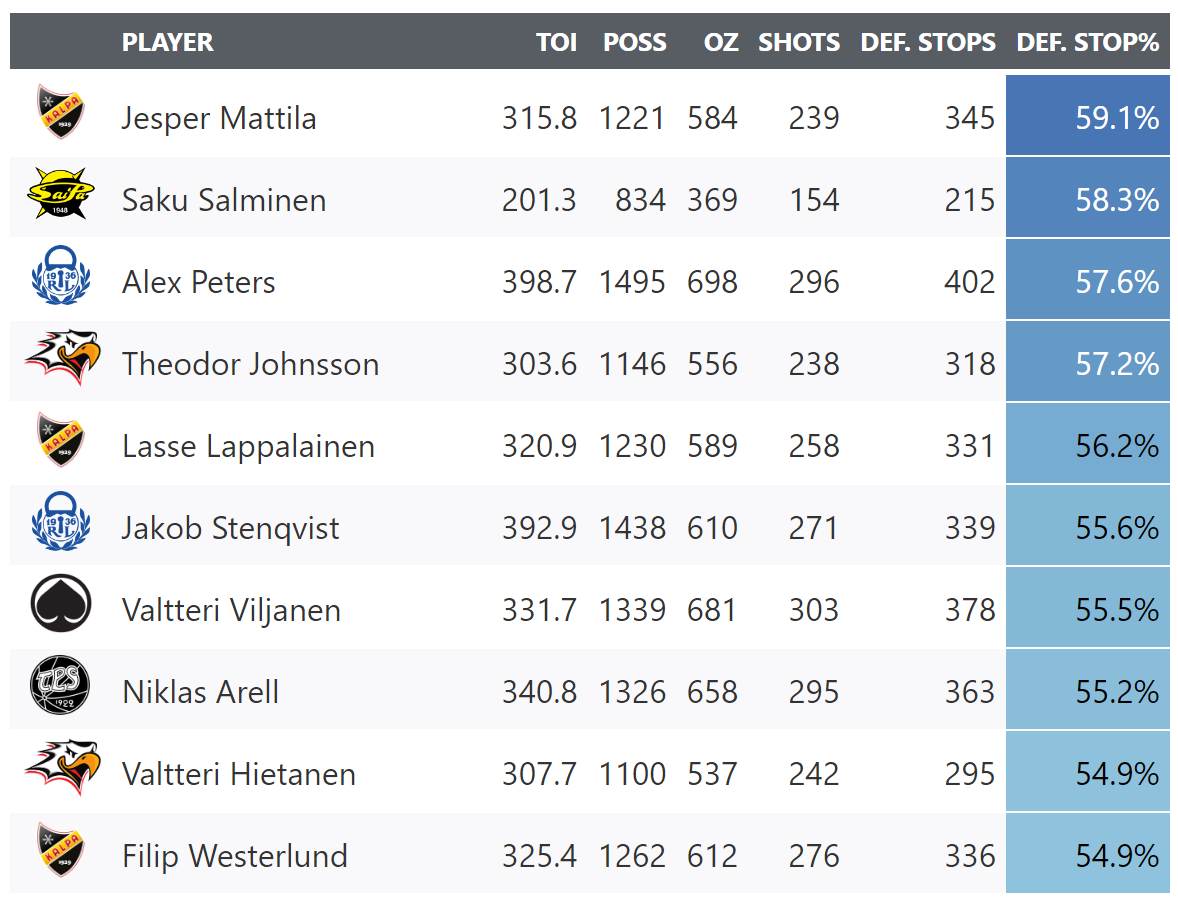
Def. Stop% being the percentage of on-ice offensive zone possessions for the opponent in the OZ on which your team did not allow a shot.
Adjustments
This, of course, comes with some major caveats. A minute ago I laid out how not all possessions are equally likely to result in offense. And the frequency with which players face each type of possession can vary quite a lot. For example, 35% of the OZ possessions against Kiekko-Espoo’s Aleksi Laakso come from OZ Recoveries, while 47% of Arttu Paaso’s start with an OZ Recovery. Similarly 26% of OZ possessions Nuutti Viitasalo faces come from Quick Breakouts, but only 14% for Ronald Knot.
But it’s not just the possession types you face, it’s also the circumstances around them. As you might expect, results on possession types can vary wildly by score state. Looking at the defensive stop rate by score state gives the following results:
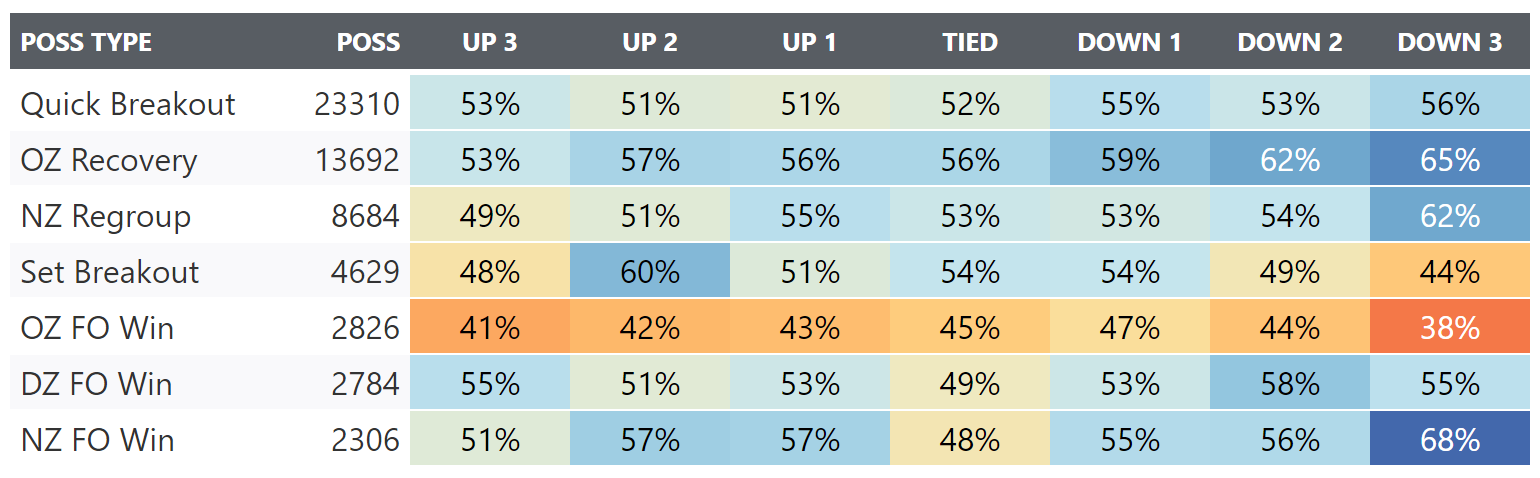
Turns out if you’re trying to defend against Liiga teams, the best way to achieve that is to give them a lead. I’m not 100% set on these rates being fully reliable as baselines yet, I’d imagine that some of the effects will smooth out with an increased sample, but since it’s everything I have for this Liiga season, let’s try to adjust the player metrics.
For every possession, I’ll have an expected rate of defensive stop, which feeds from the table you see above. I.e. if a defender faces 5 opponent quick breakouts with his team down by 1 and 5 OZ recoveries with his team down by 2, you’d expect 5 * 0.55 + 5 * 0.62 = 5.85 defensive stops. Anything above that and he might be doing something right.
So let’s do that for all 5v5 possessions and check the top 10 Liiga defenders by relative Defensive Stop Rate:
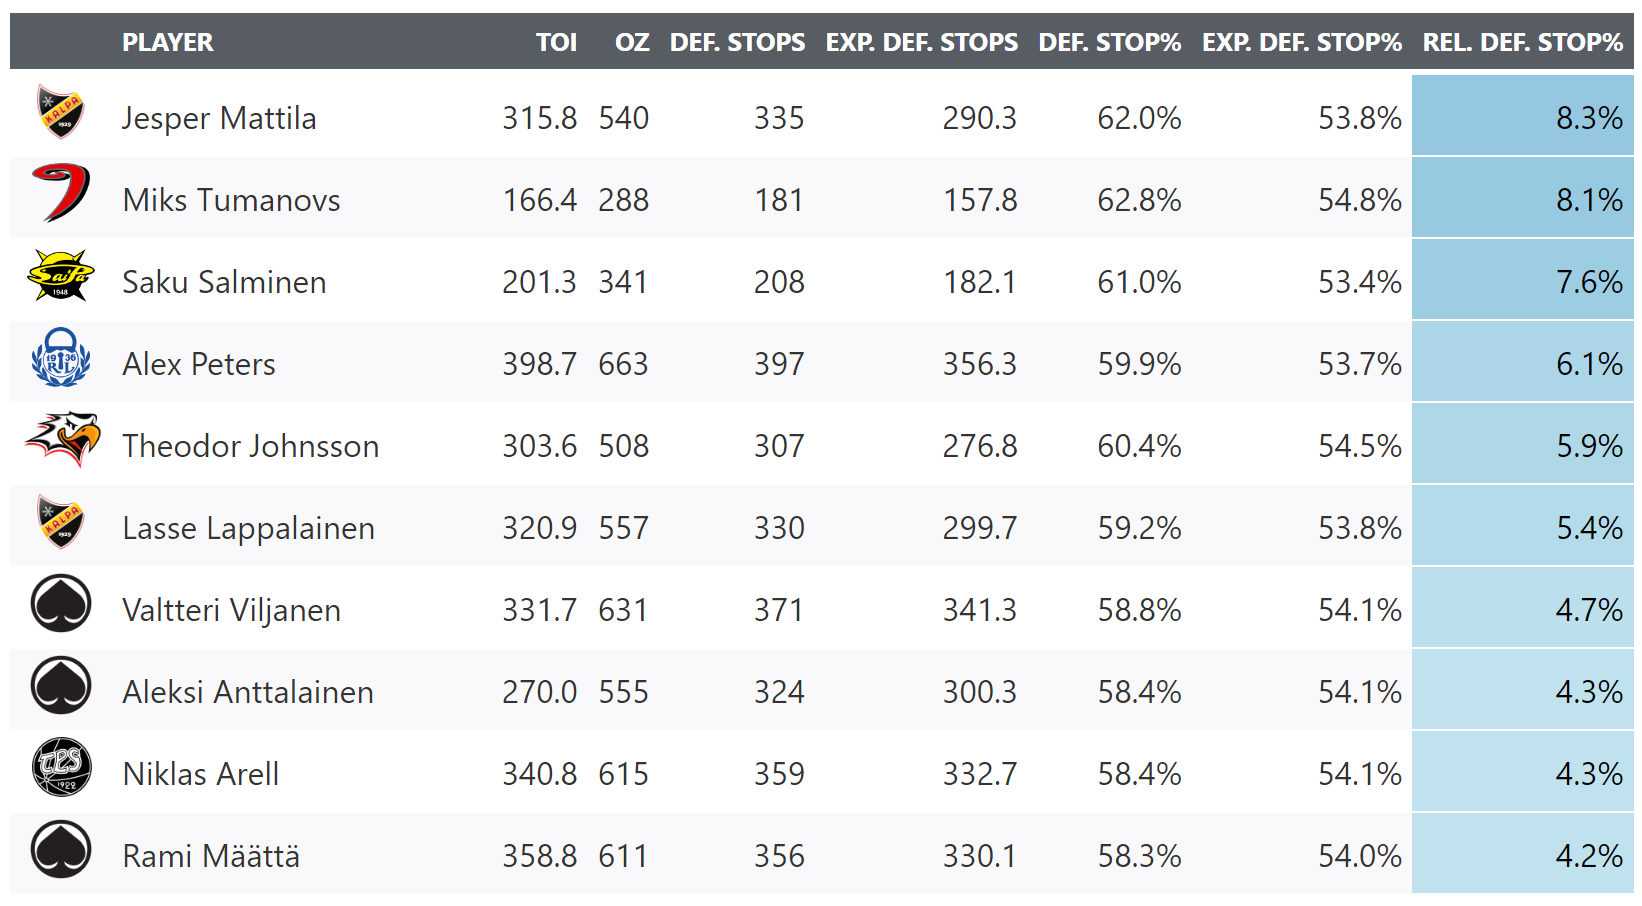
and the bottom 10:
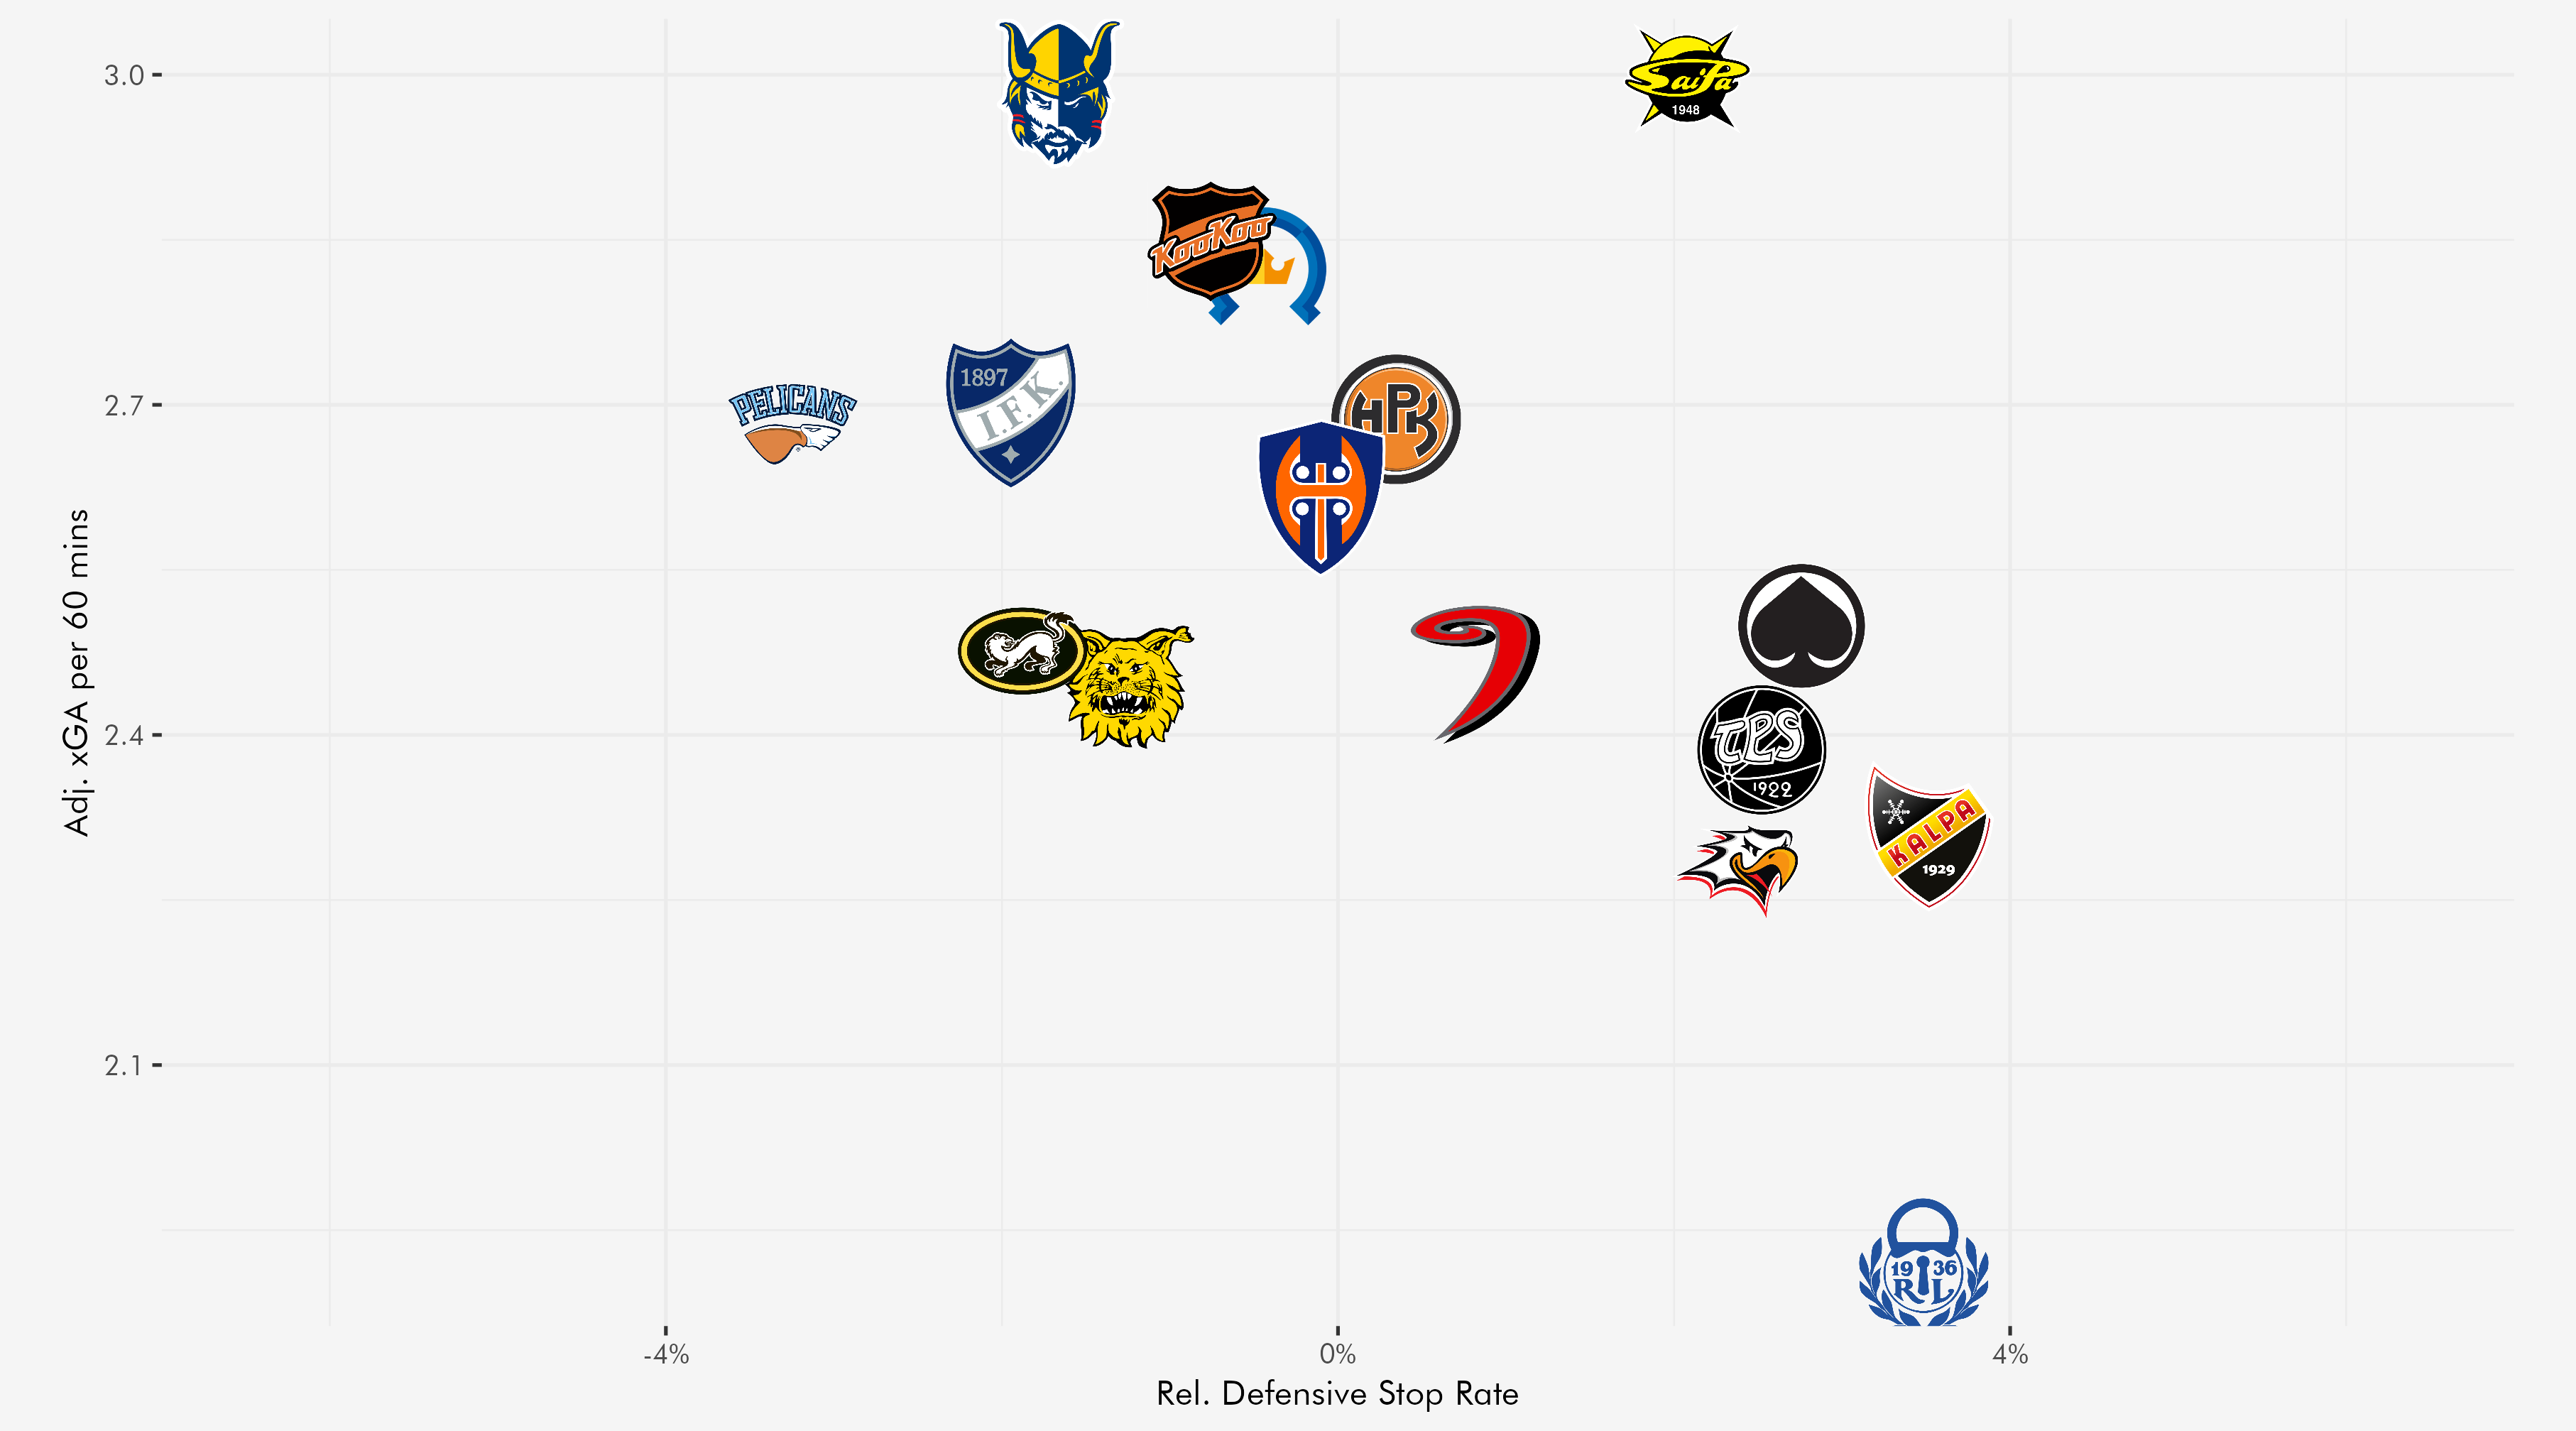
At least on a team level this seems to somewhat correlate with preventing chances against. Which is obvious but worth checking out even if it’s just to make sure there’s no fatal error in the code:
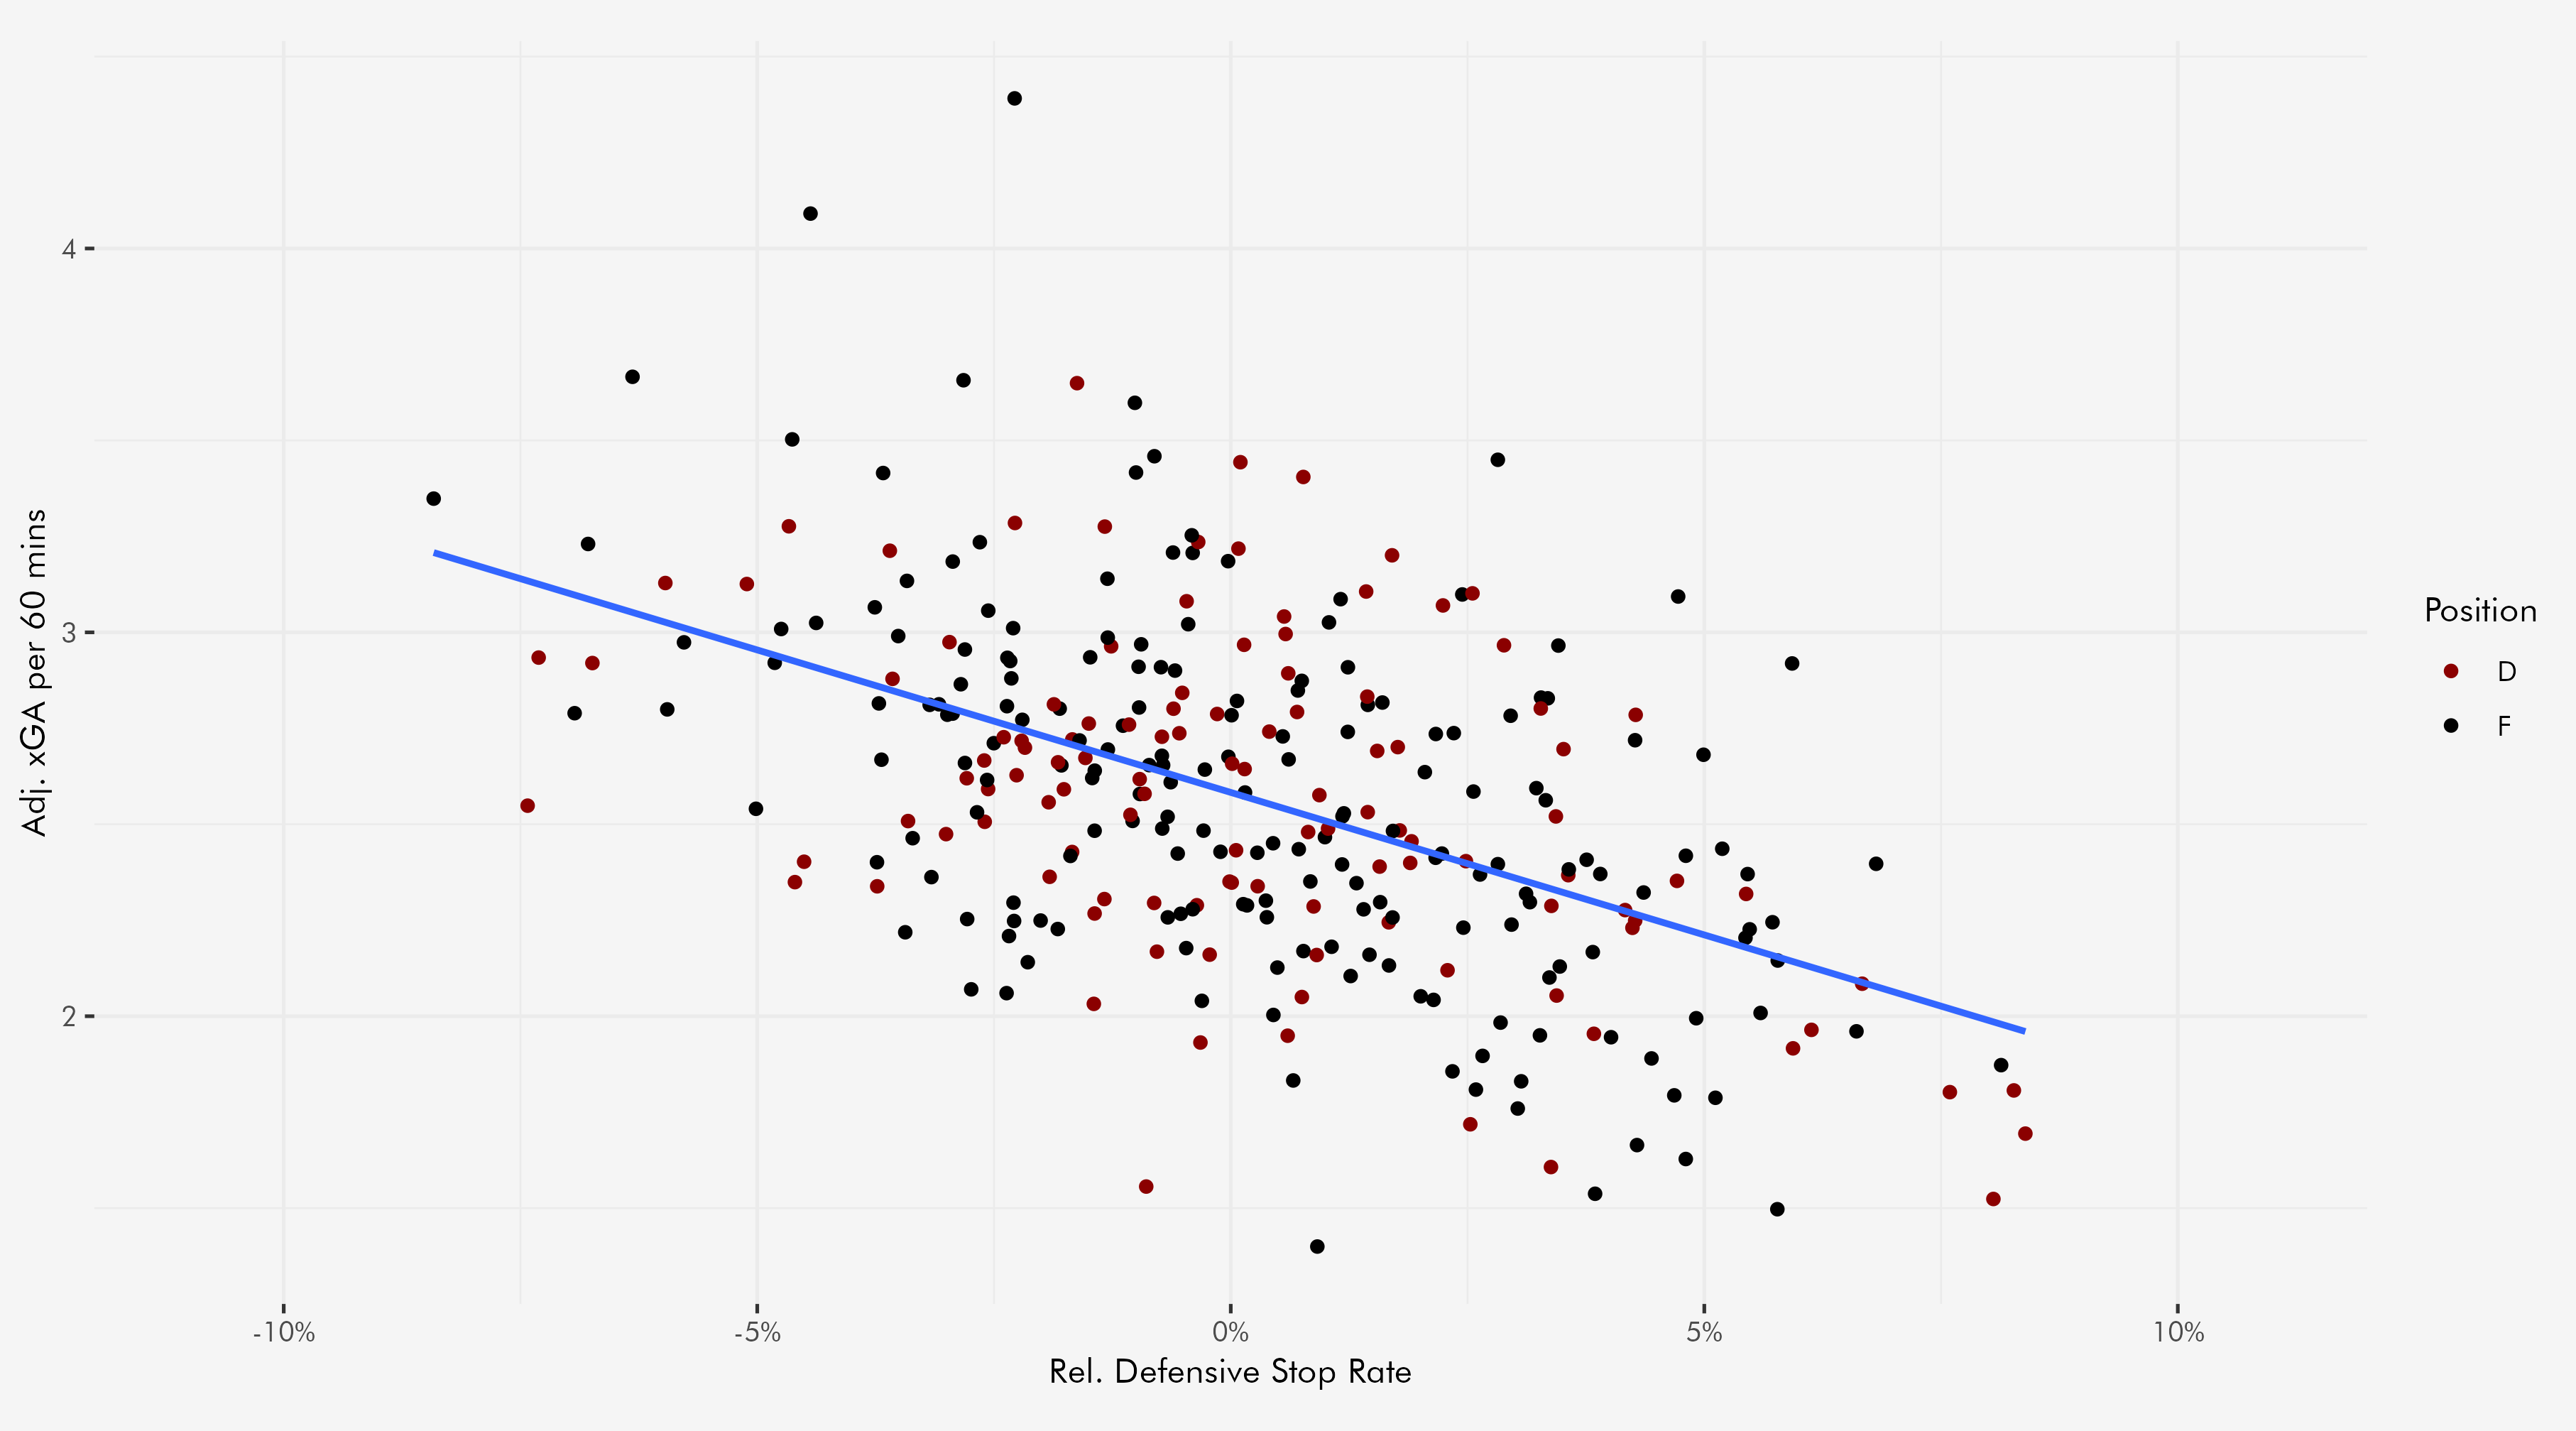
The same is true at the player level
Though it sure seems like there’s lots of overlap of teams, with Pelicans and Jukurit having multiple guys in the bottom ten and three Ässät defenders in the top ten.
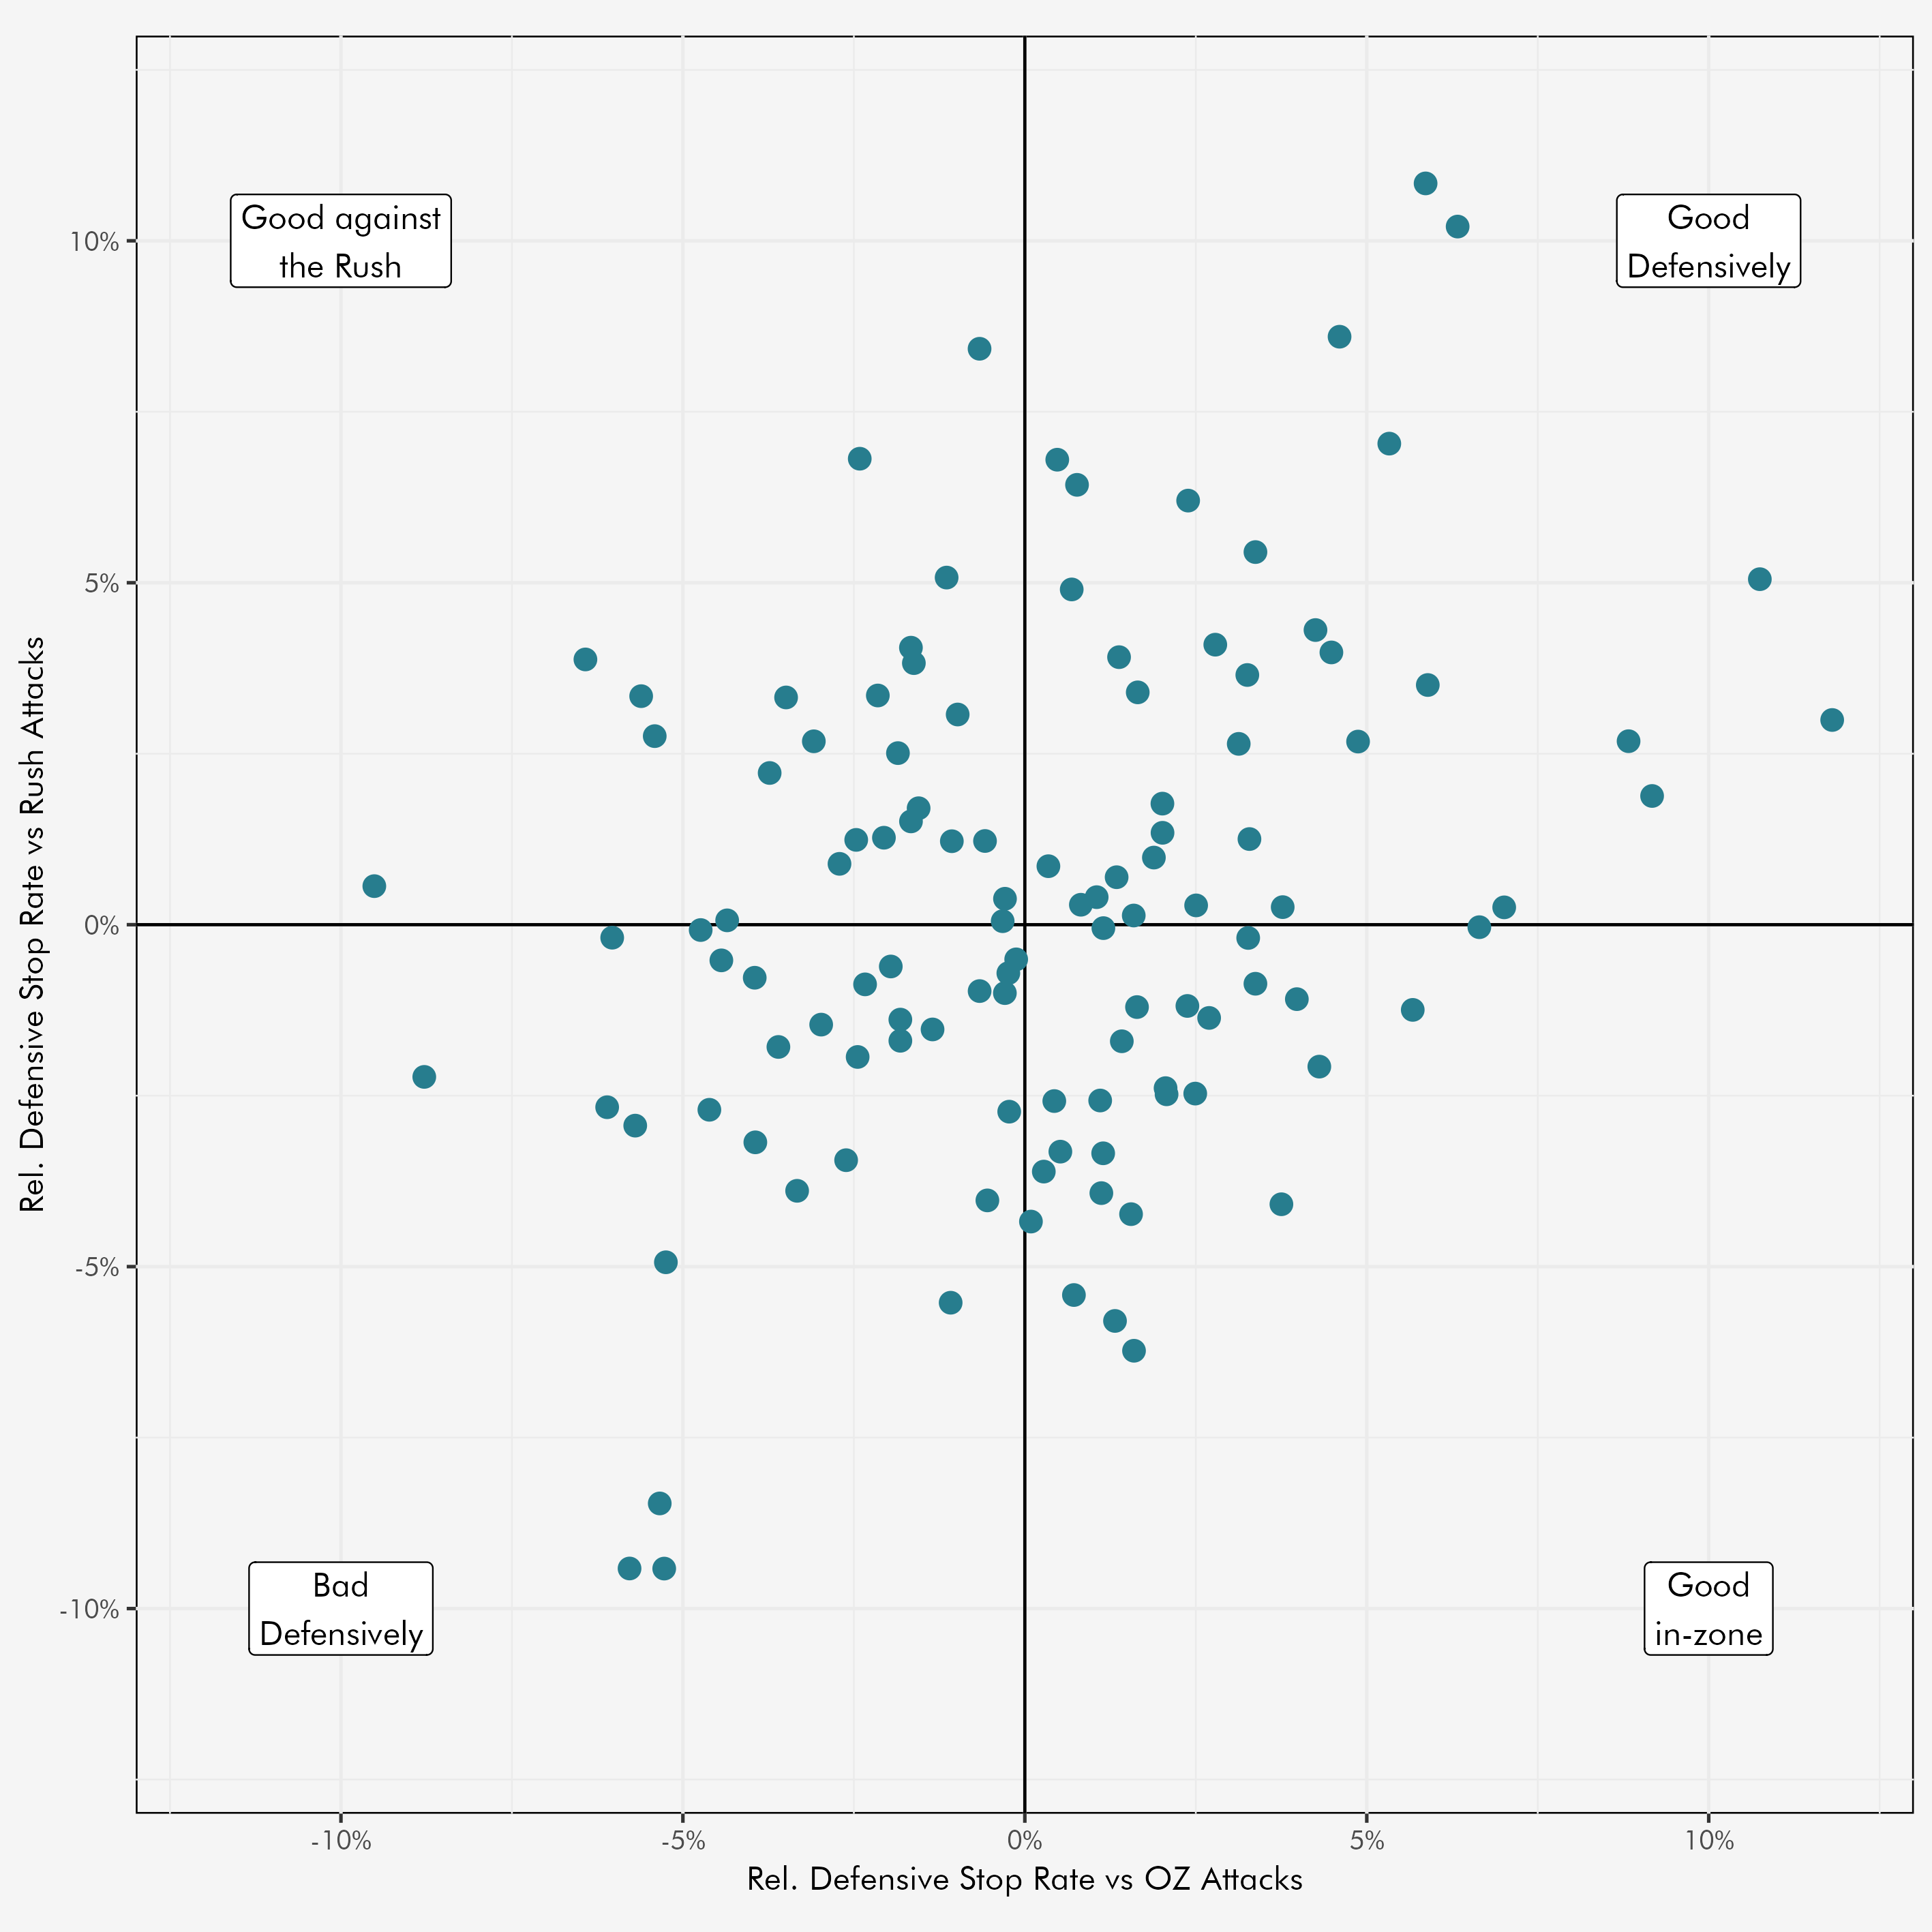
Maybe it’d make more sense to view the players by team. And similar to what I discussed in my article on slot entries, it might interesting to see the split by rush attacks and attacks from within the OZ (i.e. defending against the rush and defending 5v5 in-zone).
Split by Situation
The scatter plot suggests the split between defending against the rush (y) and defending against OZ possession (x) is a useful one:
But as mentioned above, splitting by team is probably still a reasonable thing to do, so let’s take a look at that split:
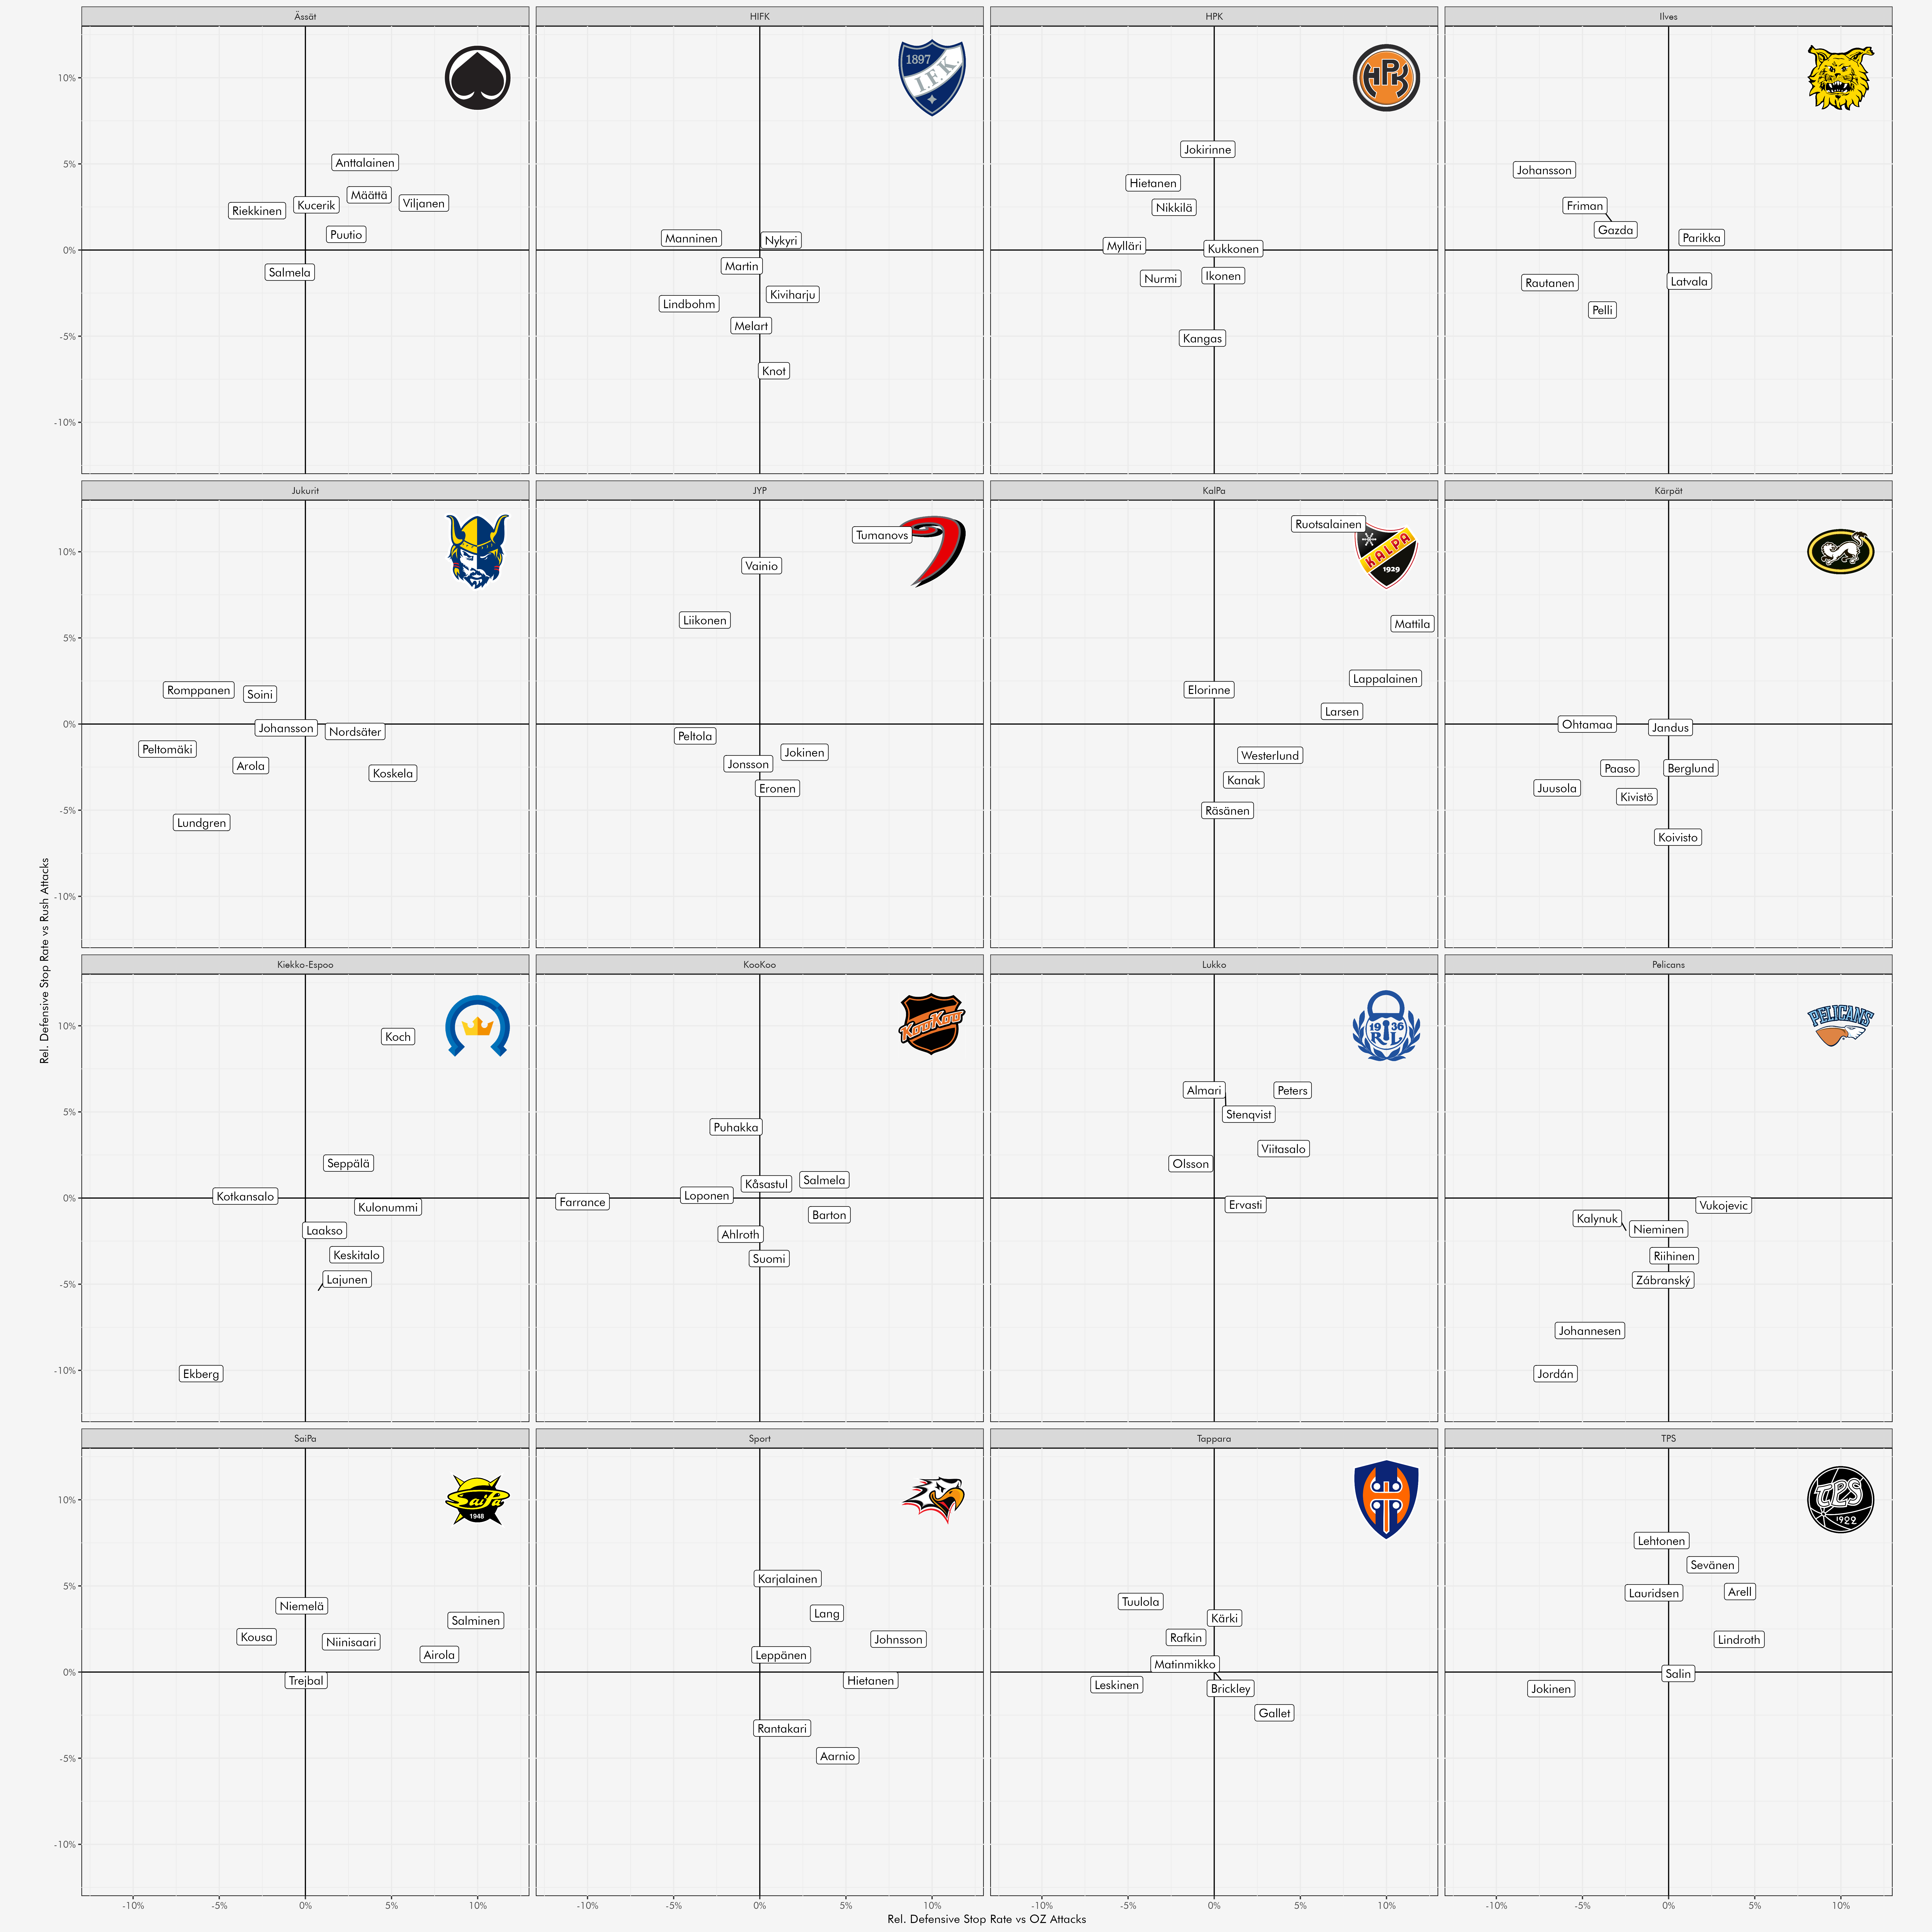
The clustering is definitely more noticeable for some teams than others. There might be something worth taking away from that. Is that due to team style or leads back to transfer preferences (“do Lukko defenders defend like this because the coach tells them to or because they signed players that just defend this way?”) could be an interesting question to try to answer.
Some ways to improve defensive stop metrics:
combine the current, shot-based definition with other conditions. Maybe a defensive stop isn’t just if the opposition doesn’t get a shot off, but if you allow an opponent possession in the slot at all, that’s not a defensive stop, whether they get off a shot or not. Or you may want to add that the possession has to end with you taking the puck back?
Something that might be possible with more detailed individual defensive data would be looking at individual disruptions of opponent’s attacks. I’m generally very skeptical of “active” individual defensive metrics - passes blocked, interceptions, shot blocks, etc. - and usually prefer on-ice metrics, but of course with better event data and tracking data, individual defending metrics could be the next significant step here.
Final Thought
There is probably a broader point to be made about defensive metrics and (public) hockey analytics’ current reliance on macroscopic metrics like rel. xGA/60 or xGA RAPMs, etc.
Since the focus here was on stopping possessions where the opponent already has puck possession in the OZ, you could argue that along with slot entry defending (see this article from last year), building out a picture of someone’s in-zone defending (alongside some pass types allowed/slot entry types allowed?). Adding metrics to judge defensive performance in other areas of the ice, like defending against zone entries and forechecking, this could broaden out the options available to judge someone’s defensive performance. Writing this, I convinced myself it might be an interesting project to try and build a more detailed defensive player profile with these components.
Both teams roughly have the same number of possessions, unless you’re outrebounded or turn the ball over much more frequently than your opponent
Why be vague? In 2024/25 Liiga play, 98.6% of all possessions end without a goal
Strength states influence the game significantly. Players playing more PP will end up with better overall offensive numbers, etc.